The Home Assistant Prometheus exporter already does the work of shipping data for Grafana to access. Working with it can be a little challenging though, and there are a few bugs, so here are some notes about the process.
Check out the Grafana Docker guide and Home Assistant Custom Panels, or use the Grafana community add-on.
PromQL Basics
All metrics will have the ha_ prefix, unless otherwise configured.
Each metric is a unit. For example, ha_temperature_c. This is a valid query.
Metrics will have labels, notably: domain, entity, env, friendly_name.
Example query to filter an entity: ha_temperature_c{domain!="climate"}
Gauges & History Graphs
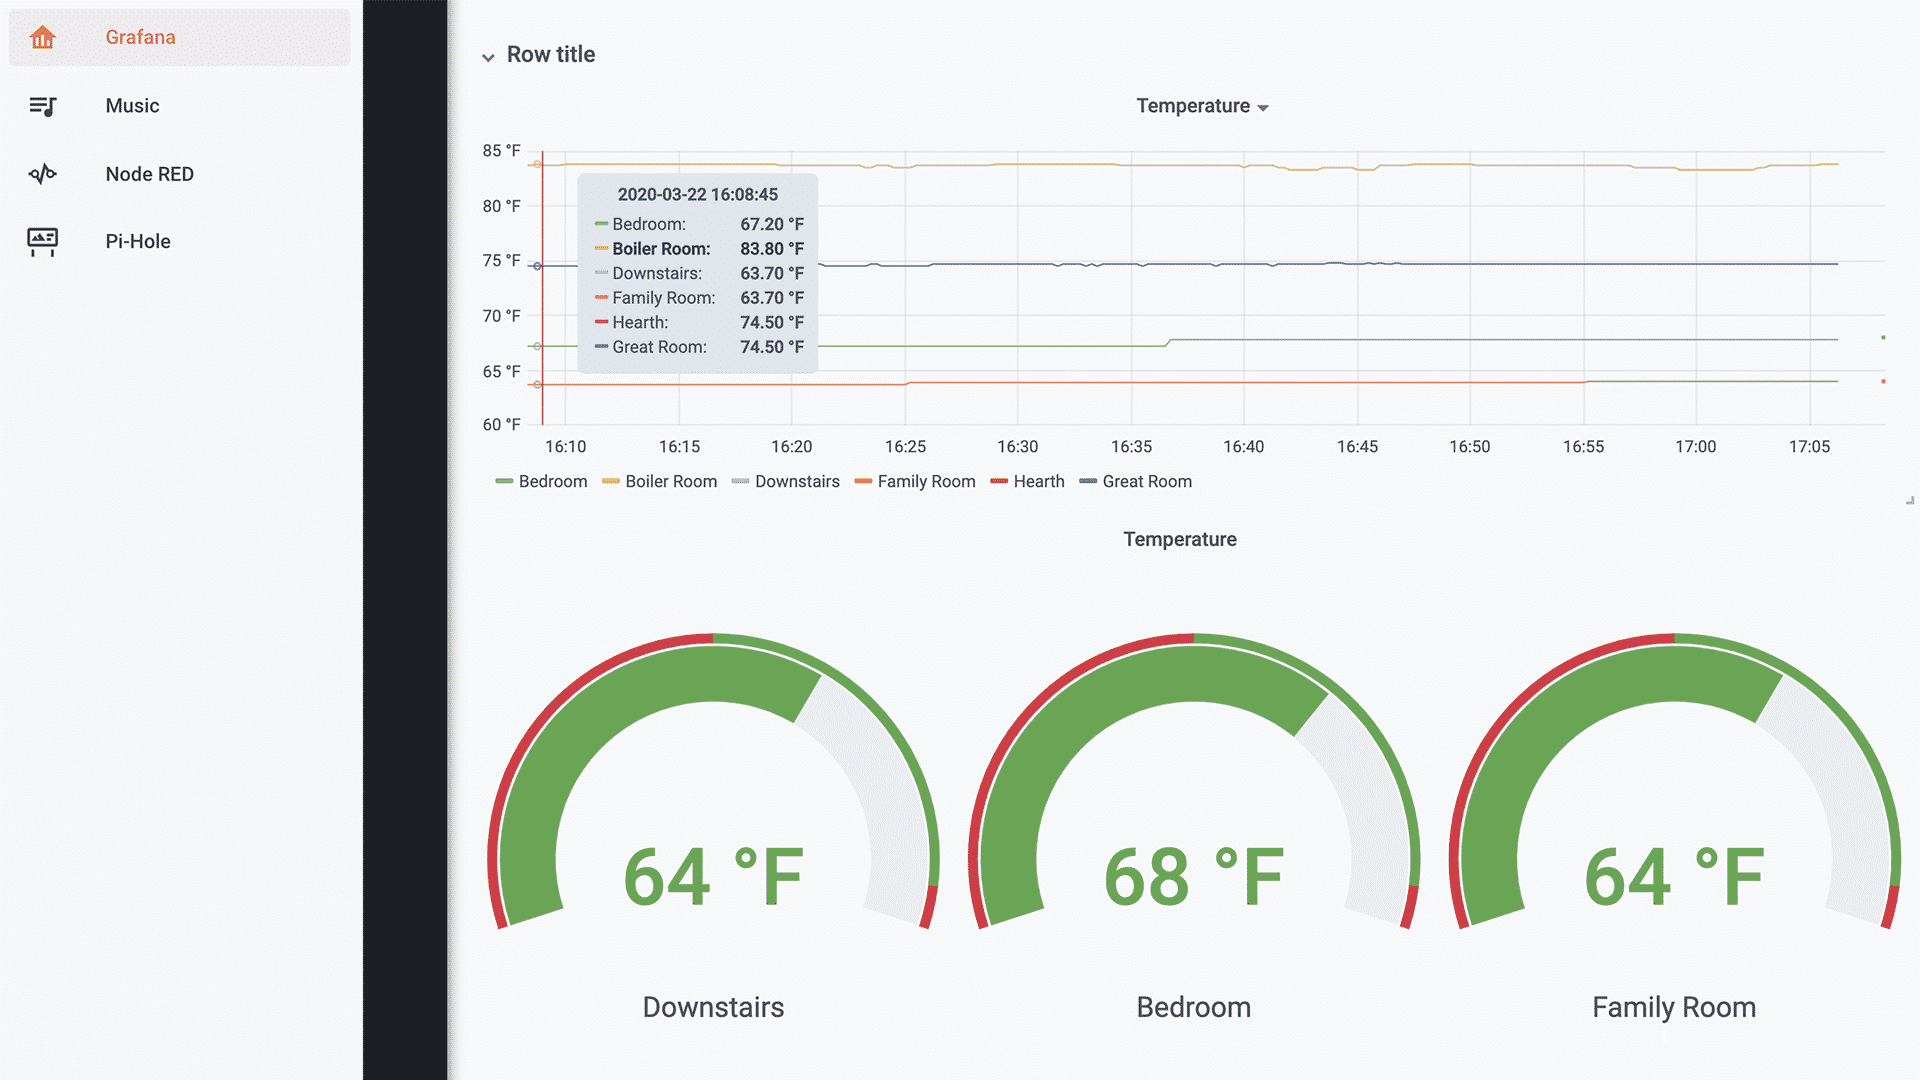
If you create a new “Gauge” visualization in Grafana and plug in the following settings, you should also see each temperature reading show up.

Note the {{ friendly_name }} used in the Legend and the Instant switch turned on. The full query is 100 > ha_temperature_c{domain="sensor"} > 0, which only returns entities that reported values between zero and 100.
While exploring data, it may seem as though some entities appear in the wrong metrics. The component_config_glob configuration can be tuned via override_metric to ensure that, say, humidity data shows up under ha_humidity_percent.

Advanced HVAC Graphs
From here on out, I’ll switch to the light theme in Grafana.
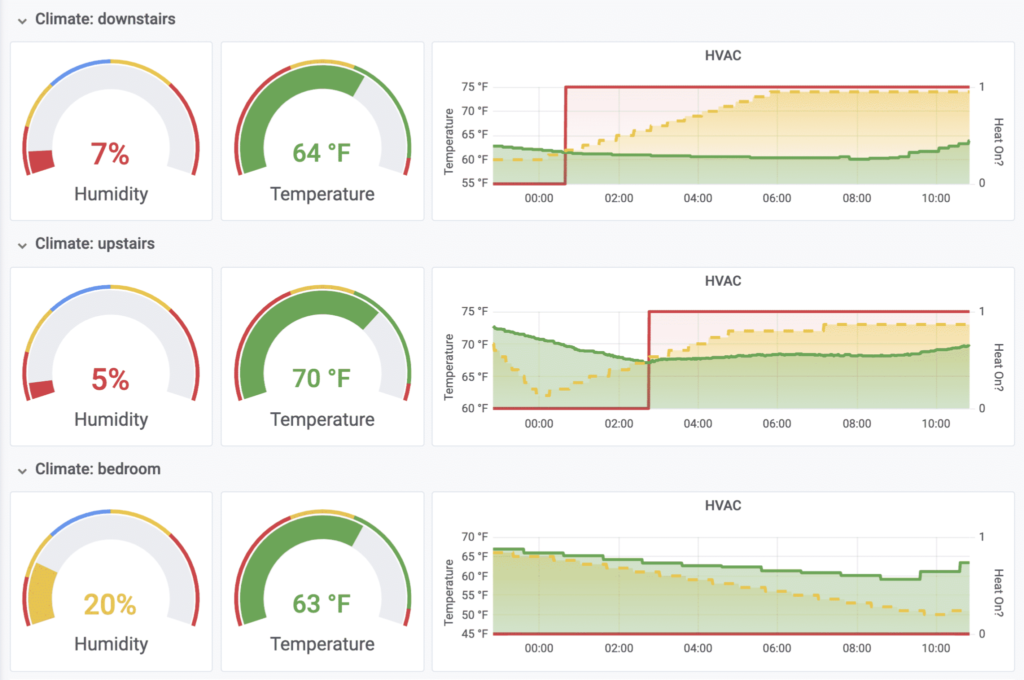
To totally get rid of the default History panel in Home Assistant, one advanced graph that needs replacing is the climate domain. The default Home Assistant integration shows both the target temperature and the current temperature simultaneously, like the graph on the right. Since the cabin has a tri-zone system (controlled by a DIY Arduino thermostat), there needs to be a graph for each zone. To achieve this, first create a Grafana dashboard Variable.
Clicking on the gear icon in the top right of the dashboard, the Variables are listed on the left side. I’ve created a ClimateZone variable which has three possible values:

For each zone, there must be two matching sensors: sensor.downstairs_temperature and sensors.downstairs_target_temperature. This is because only the actual state values are exported to Prometheus, and not the attributes of the climate domain. One way to achieve this easily is with custom sensors. In my case, I use a generic_thermostat that gets its temperature from an average of the temperatures in the room, and then reflects its target temperature back out. Check out the DIY IOT Cabin series for more on how these 100% custom pieces work:
sensor:
  - platform: template
    sensors:
      upstairs_temperature:
        friendly_name: Upstairs
        unit_of_measurement: "°F"
        device_class: temperature
        # Average temperature of sensors in room:
        value_template: >-
          {% set ts = [
            states('sensor.hearth') | float,
            states('sensor.stairwell_temperature') | float
          ] %}
          {{ ts | sum / ts | count }}

      upstairs_target_temperature:
        friendly_name: "Upstairs HVAC Target"
        unit_of_measurement: "°F"
        device_class: temperature
        value_template: "{{ states.climate.upstairs.attributes.temperature }}"

climate:
  - platform: generic_thermostat
    name: Upstairs
    initial_hvac_mode: "heat"
    heater: switch.radiators_upstairs
    target_sensor: sensor.upstairs_temperature
    target_temp: 60
    away_temp: 50
    min_temp: 40
However you do it, the important bit is that you can now use Regex for the sensor names, substituting the $ClimateZone variable:

To achieve the dashed lines for the target temperature and other stylistic polish:

Finally, use the third tab (gear) to enable the “Repeating” feature for the ClimateZone variable, causing the panel to be repeated for each (enabled) zone…
Photo Gallery
Click to enlarge…

Home Assistant Panel
It is possible to turn off the login screen n a custom home assistant panel, you may also want to turn off the Grafana login. Then, any user can access the panel without logging in. Just be careful to either not allow outside access to Grafana, unless you want your data available to anybody to see 😉


Hi
Many thanks for this tutorial.
Am I missing something here ? the current version of the Grafana plug-in (on HA) does not have metrics any more and consequently that does not allow us to use regex.
Is there any chance to modify the page based on the current version of Grafana so we can follow your tutorial, please?
Actually, Grafana does not store data. It’s only for graphs. It’s not a database. I use the Prometheus exporter, just as described in the first sentence of the post. It still works. You need to configure HA+Prometheus appropriately to export the data, per the docs.